
Game On, Bank On It, Pill Pop, and Power Up: A Wild Ride Through Diverse Industries
Goodbye Weekend, Hello Stock Market: Time to Trade That Sunday Scaries for Monday Money Moves!

Notable Flow:
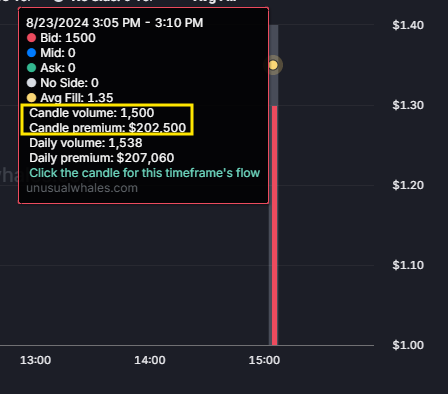
SLNO 0.00%↑ 50C 9/20 Exp. BTO & 60C 10/18 Exp. STO Bullish Diagonal Spread
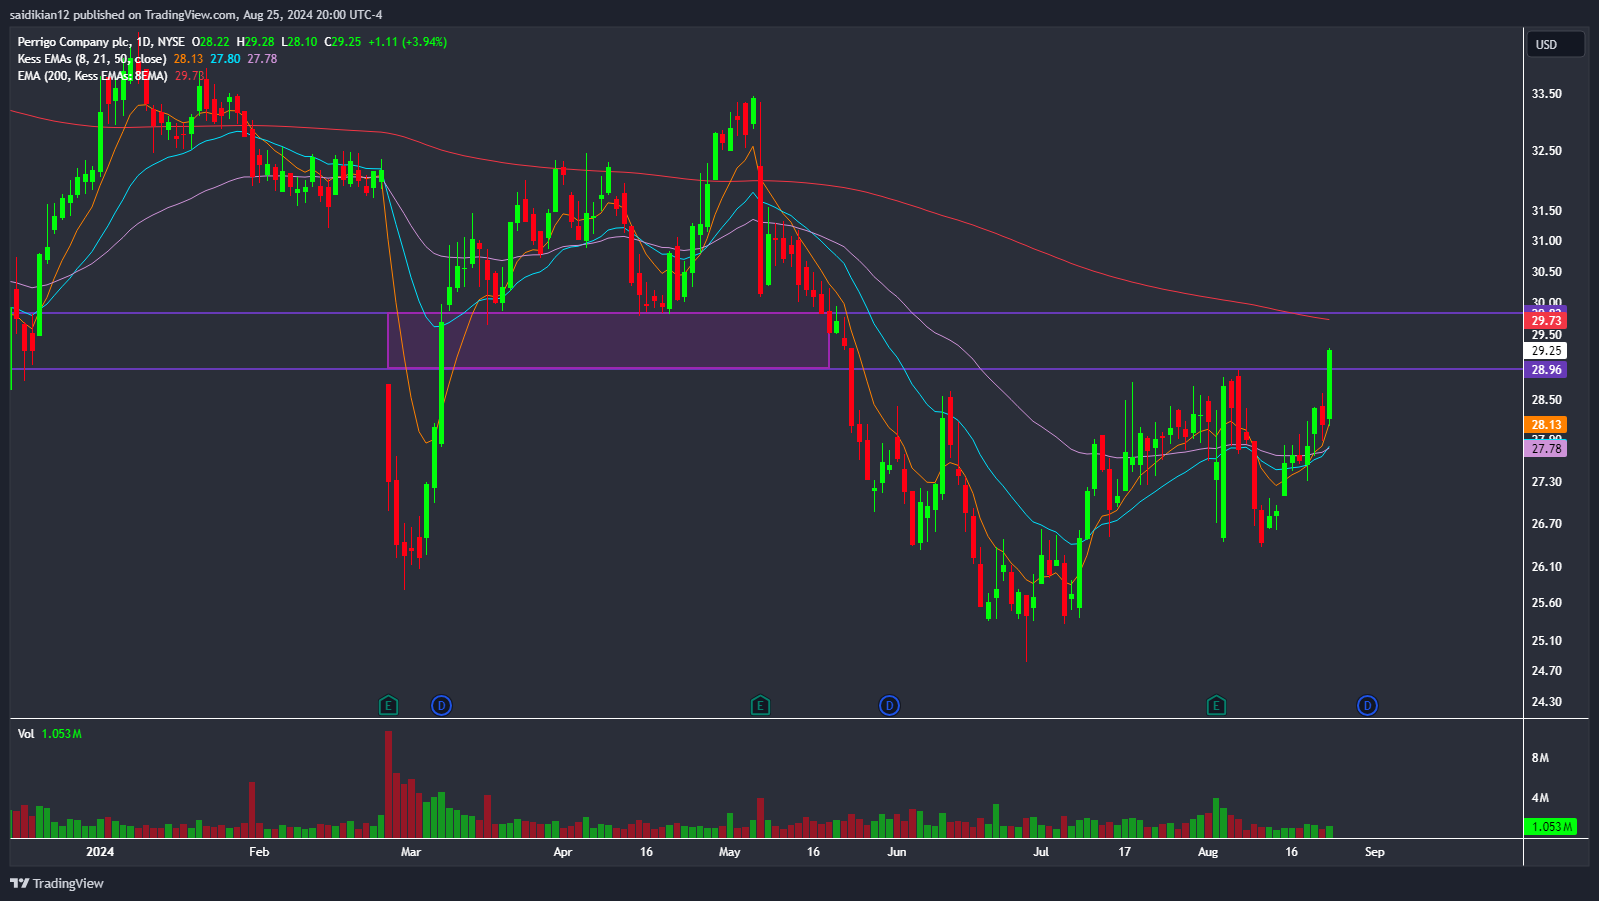
PRGO 0.00%↑ 30C 11/15 Exp.
PTEN 0.00%↑ 11C 11/15 Exp. BTO & 9P 11/15 Exp. STO Bullish Risk Reversal
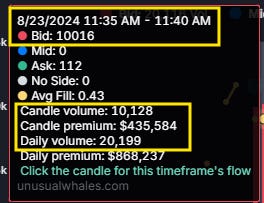
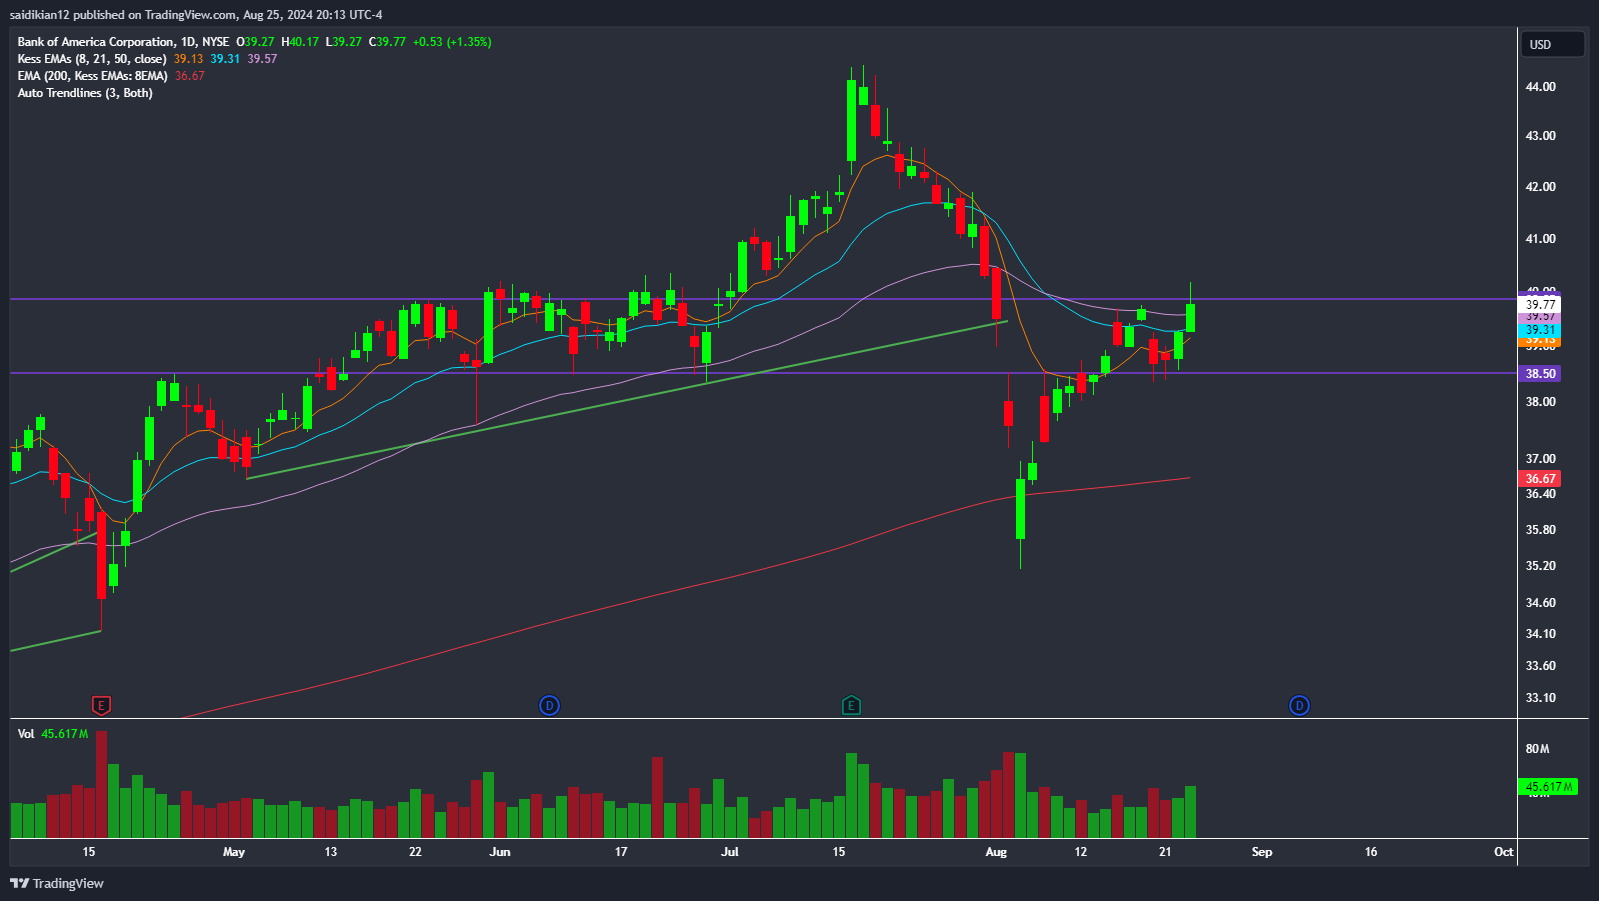
BAC 0.00%↑ 43C 10/18 Exp. STO
TTWO 0.00%↑ 170C 09/27 STO
SLNO 0.00%↑ 50C 9/20 Exp. BTO & 60C 10/18 Exp. STO Bullish Diagonal Spread
1.5k contracts of the 50C for $525k and 1.5k contracts of the 60C for $203k. Net cost per contract: $2.15 x100

This Whale is moderating the trade risk by selling the 60C on credit and using that credit to buy the 50C. The charts below show when the trader’s orders were filled on both chains between 3:05 PM and 3:10 PM ET on Friday, 08/23.

The company recently submitted a New Drug Application (NDA) to the U.S. Food and Drug Administration (FDA) for Diazoxide Choline Extended-Release (DCCR) for the treatment of Prader-Willi Syndrome (PWS) in individuals four years and older who have hyperphagia.

Chart: Now if we are looking at the daily chart, has been consolidating between 42.87 and 52.58. Currently, it is below the majority of the EMA’s (8,21,50). This whale will be sweating just a bit more than usual if it breaks this daily support. Would like to see it reclaim the 50EMA to have a bit more confidence on this trade.
PRGO 0.00%↑ 30C 11/15 Exp.
Vol: 5,198 OI: 419 Avg: $2.02 Prem: $1,050,987

This trade was placed by a Floor Trader, meaning that it took place on the floor of an exchange. The left side of the chart above shows two spikes in volume at different times, one with 2.5k contracts at the Ask and the other with 1.5 contracts at the Ask. Both trades were placed by the same trader. If our guess is correct, OI on Monday, 08/26, should be around 5.5k.
This is the highest Options volume that the stock has had in the past 45 days, as can be seen in the chart below.

Chart: Nice breakout of that 28.96 resistance, now aiming to fill that previous gap that was made from two earnings ago. Next target would be around the 200ema at 29.73, which would put this whale very close to ITM. If there is a rejection when market opens, we would expect a pull back to the 21ema at 27.80.
PTEN 0.00%↑ 11C 11/15 Exp. BTO & 9P 11/15 Exp. STO Bullish Risk Reversal
Buying 13k contracts of the 11C for $390k and Selling 10k contracts of the 9P for $500k

This trader speculates that the stock will go up and volatility will remain the same or increase. Using this strategy, the trader receives credit for selling the 9P and uses that credit to buy the 11C. How does this trade work? If the stock price is between 9 and 11, the PnL will break even; above 11, the PnL will be positive; below 9, the PnL will be negative.
Chart: Just an ugly chart to be completely honest. The whale receive the premium if it breaks and holds above that 9.53 daily resistance. Above the 8ema, bullish if it can reclaim above the 21ema. Rejects this key resistance, would not be surprised if it heads back down to 8.63. Dividends coming up

BAC 0.00%↑ 43C 10/18 Exp. STO
Vol: 20,978 OI: 4,729 Avg: $0.43 Prem: $896,160

This Whale is bearish in the stock by selling these calls. The chart above (left side) shows the two spikes in volume, with both candles having approximately 10k contracts traded at the Ask. With an OI of 4.7k and volume of 20k, we can discard the calls being closed and assume that they are opening all or almost all of these contracts.
The charts below show both trades in more detail:

The Chart: Fairly simple chart. Back in May in June as you can see, BAC was having a lot of trouble breaking out of that 39.87 level, until it finally broke out. This whale better be hoping that it doesn’t break out or else it could be paying a much higher price to close out those sold calls. A nice reject could take this back to 38.5
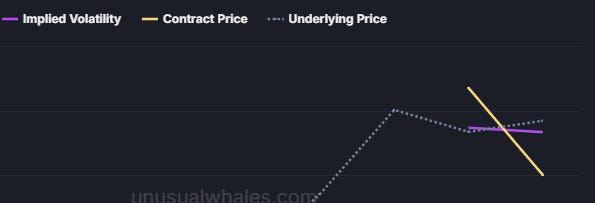
TTWO 0.00%↑ 170C 09/27 STO
Vol: 3,149 OI: - Avg: $1.05 Prem: $331,864

This Whale opened the trade within 15 minutes of the market opening on Friday, 08/23. With no OI in this chain, it can be assumed that the trade has been opened. Looking at the Bid action, we can see the decline in implied volatility and the net premium while the calls were traded. It can be assumed that the trade was STO.

The Chart: After looking at the chart, feel kind of nervous for this whale. Flagging on the daily, with declining volume. The 21EMA crossing the 50EMA (bullish). What the whale needs to hope for is this flag just breaking down to the 8ema which would be around 154.3.

Thank you for reading tonight's newsletter! Wishing you the best of luck as you head into the week ahead. Feel free to reach out with any questions, share your feedback, or chat with us about the setups you're noticing!
Thanks for reading,
